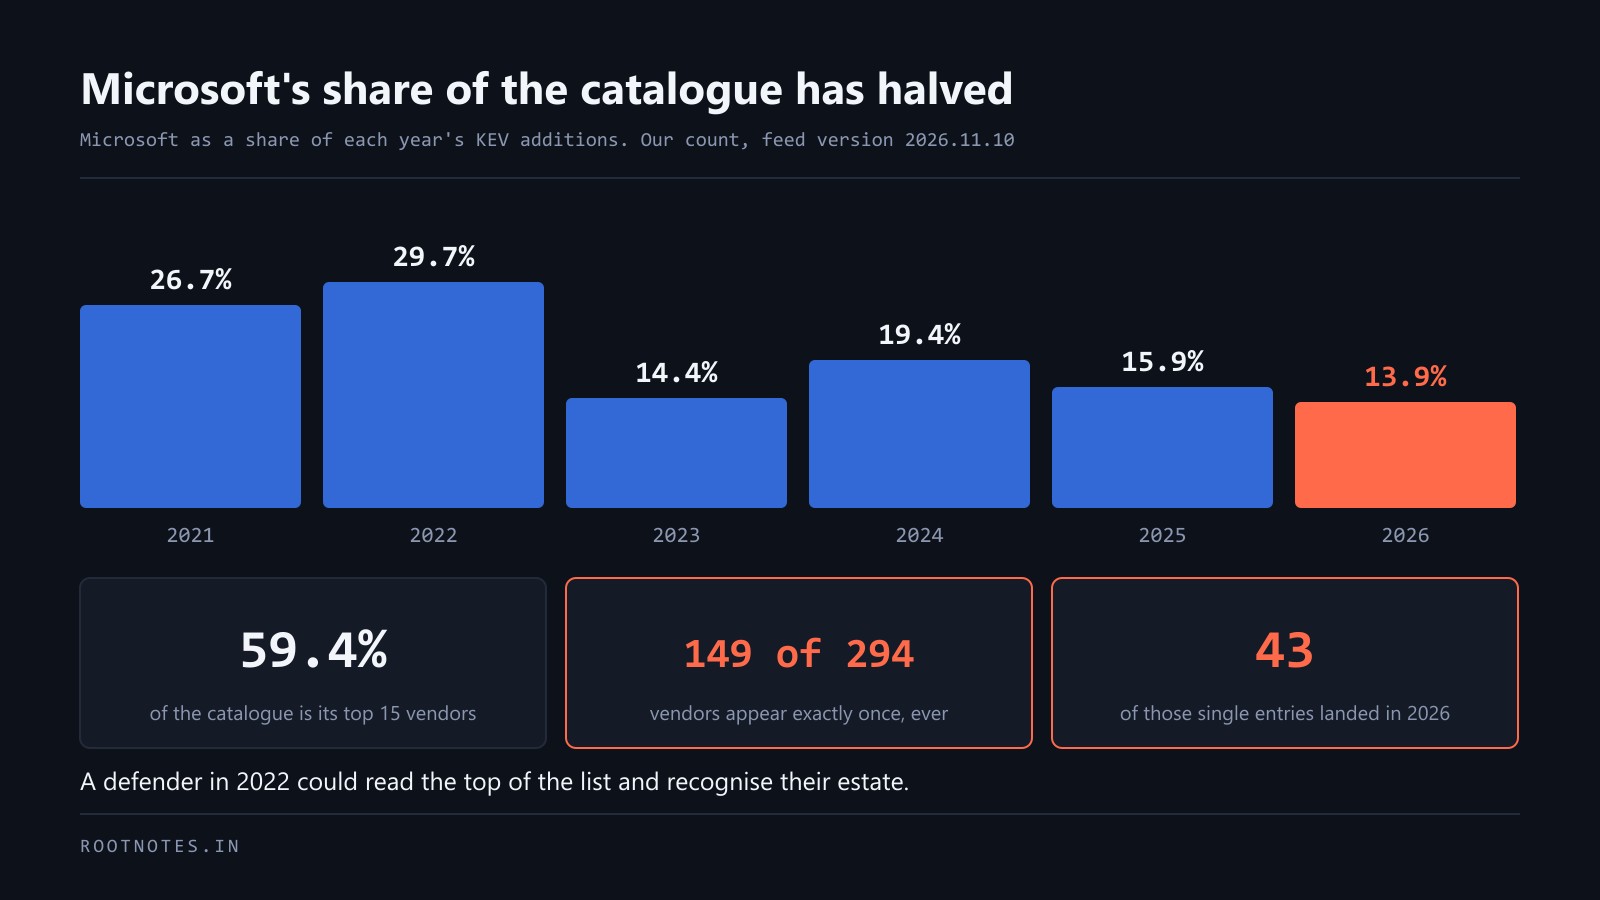
Microsoft's share of each year's additions to CISA's Known Exploited Vulnerabilities catalogue, counted from feed version 2026.11.10:
- 2021: 26.7 per cent
- 2022: 29.7 per cent
- 2023: 14.4 per cent
- 2024: 19.4 per cent
- 2025: 15.9 per cent
- 2026: 13.9 per cent
From nearly a third of the catalogue to under a seventh. All-time, Microsoft is 391 entries of 1,779, which is 22.0 per cent and still comfortably the largest single vendor.
The interesting question is not why Microsoft fell. It is where the share went.
It did not go to another giant
The top fifteen vendors account for 59.4 per cent of the catalogue: Microsoft, Cisco, Apple, Adobe, Google, Oracle, Apache, Ivanti, Linux, Fortinet, Citrix, D-Link, VMware, SonicWall, Synacor. None of them grew enough to absorb what Microsoft lost.
The share went into the tail. And the tail is remarkable.
There are 294 distinct vendors in the catalogue. 149 of them appear exactly once, ever. More than half of every organisation named in the catalogue of actively exploited vulnerabilities contributed a single entry in its entire history.
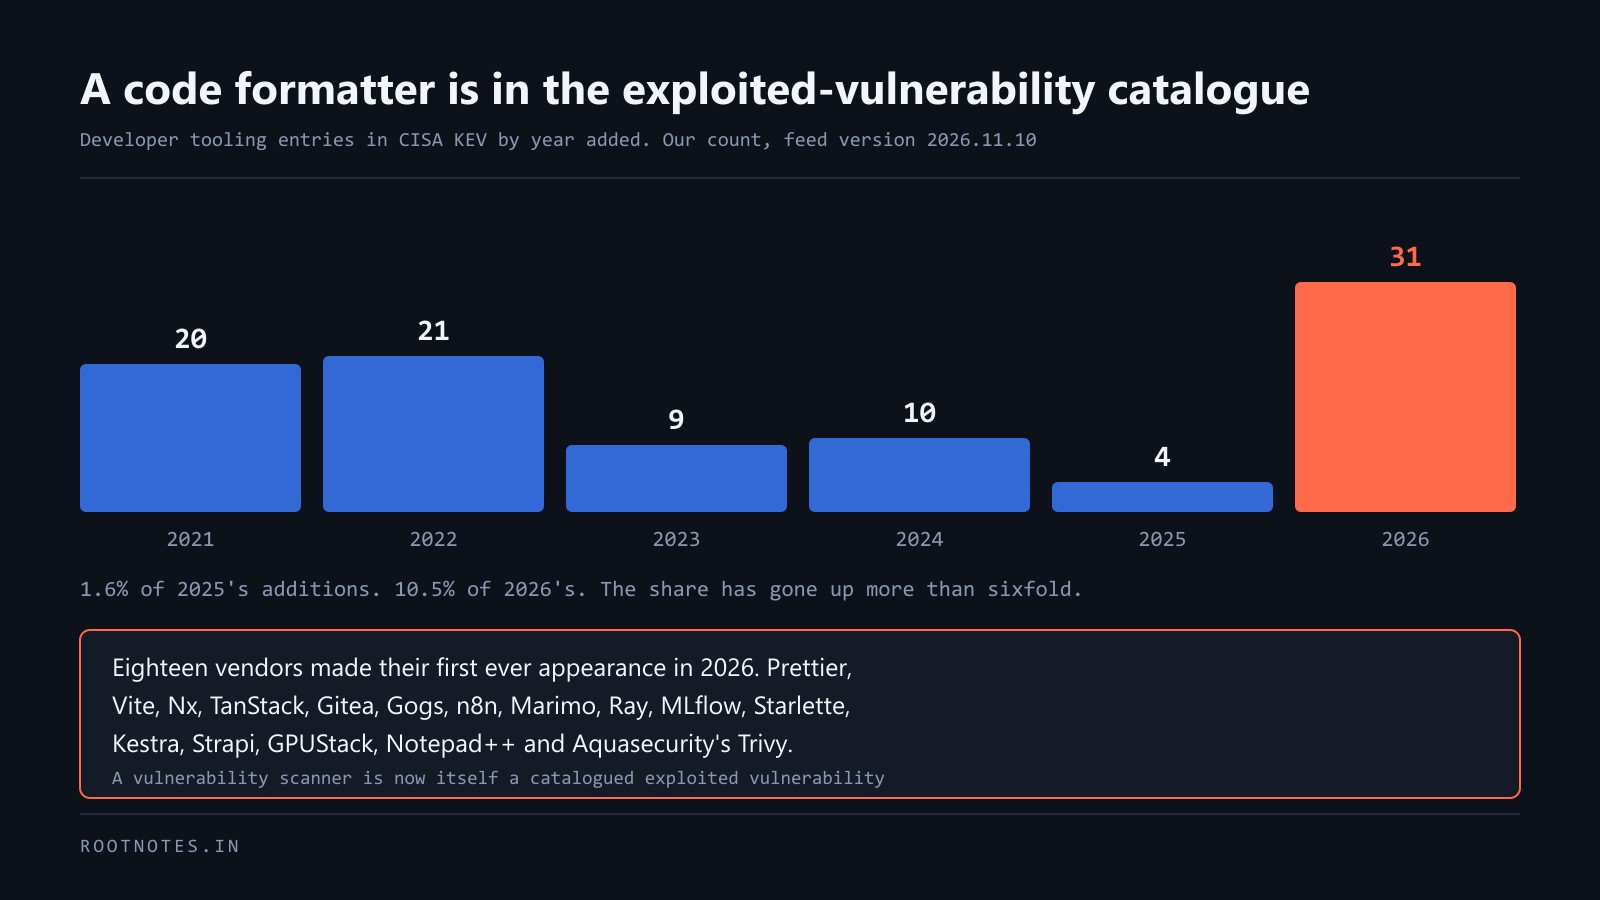
Forty-three of those single entries landed in 2026. Openwave. GPUStack. SignalWire. Collabora. Strapi. ONLYOFFICE. ProFTPD. Kestra. Gitea. Splunk. Lantronix. PTC. Rockwell. Notepad++. Vite. Prettier. Nx. TanStack. Marimo. n8n. And twenty-odd more.
And nineteen of those forty-three carry a CVE identifier that predates 2026, including CVE-2015-5477 in ISC BIND, an eleven-year-old flaw making its first appearance in the catalogue in October 2026.
What this does to a defender
In 2022 a security team could read the top of this catalogue and recognise their estate. Microsoft, a VPN appliance, a mail server, a browser. The list described a small number of products that almost everyone ran, and "is this us" was answerable in an afternoon.
In 2026 the list describes almost everything. A long tail of vendors most people have never heard of, many of them libraries and tools rather than products, many of them things that arrived in an environment as a transitive dependency rather than through a purchase.
The question "is any of this mine" has gone from an afternoon to a genuine engineering problem requiring an accurate software inventory, which remains one of the least solved problems in the field.
This is, to be clear, the catalogue getting more honest. The narrow early catalogue was not an accurate picture of what attackers exploit; it was an accurate picture of what was being reported about what attackers exploit, filtered through where the attention was. Broadening it is correct. It is also considerably harder to act on, and nobody has acknowledged that trade.
The absolute numbers tell a different story
A falling share is not the same as a falling count, and conflating them is the easiest mistake to make with this data.
Microsoft's absolute additions by year run 83, 165, 27, 36, 39, 41. The 2026 figure is higher than 2025, higher than 2024, and higher than 2023. Microsoft is not appearing in the catalogue less often than it did three years ago. It is appearing slightly more often.
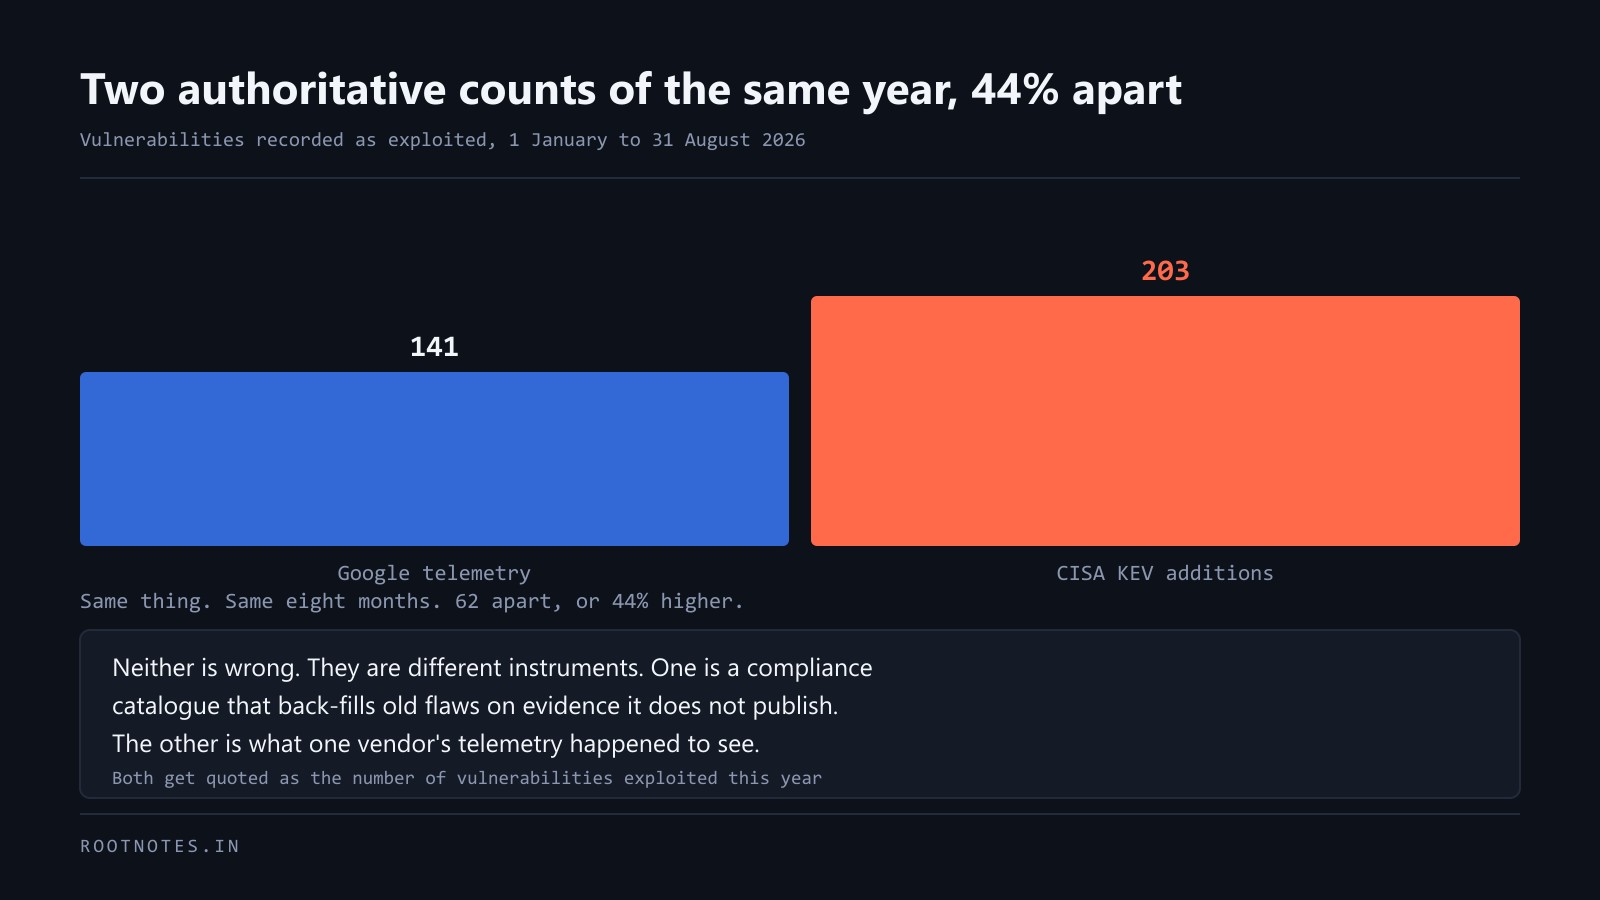
What changed is the denominator. The catalogue added 295 entries in 2026 against 186 in 2024, and almost all of that growth came from somewhere other than the top of the list.
So the honest sentence is not "Microsoft products are being exploited less". It is "everything else is being catalogued more", which is a statement about the catalogue before it is a statement about anyone's software.
Two readings, and we do not know which is right
Reading one: the attack surface genuinely diversified. Microsoft hardened its platform substantially over this period, attackers followed the path of least resistance into smaller vendors and open-source components, and the catalogue is tracking a real migration.
Reading two: the catalogue's coverage improved. Exploitation of small vendors was always happening and was never catalogued, because nobody was looking and no evidence reached CISA. More researchers, better telemetry and a broader intake produce the same curve without anything in the real world changing.
Both are plausible, both are probably partly true, and this data cannot separate them. Anybody who tells you confidently which one it is has not looked at the numbers.
What is not established
- All counts are ours, from feed version 2026.11.10, grouped by date added. The catalogue is edited and a later feed will differ slightly.
- Vendor names are as CISA records them, which is inconsistent. The same organisation can appear under different strings, which would understate concentration. We did not normalise them.
- The 2021 and 2022 figures reflect the catalogue's founding period, when a large back-file was loaded at once. That makes them a poor baseline, and the comparison that matters is 2023 onward, where the fall is gentler but still clear.
- Nothing here measures Microsoft's actual security posture. A falling share of a growing, broadening catalogue is not the same as fewer exploited flaws, and the absolute count went from 39 in 2025 to 41 in 2026.