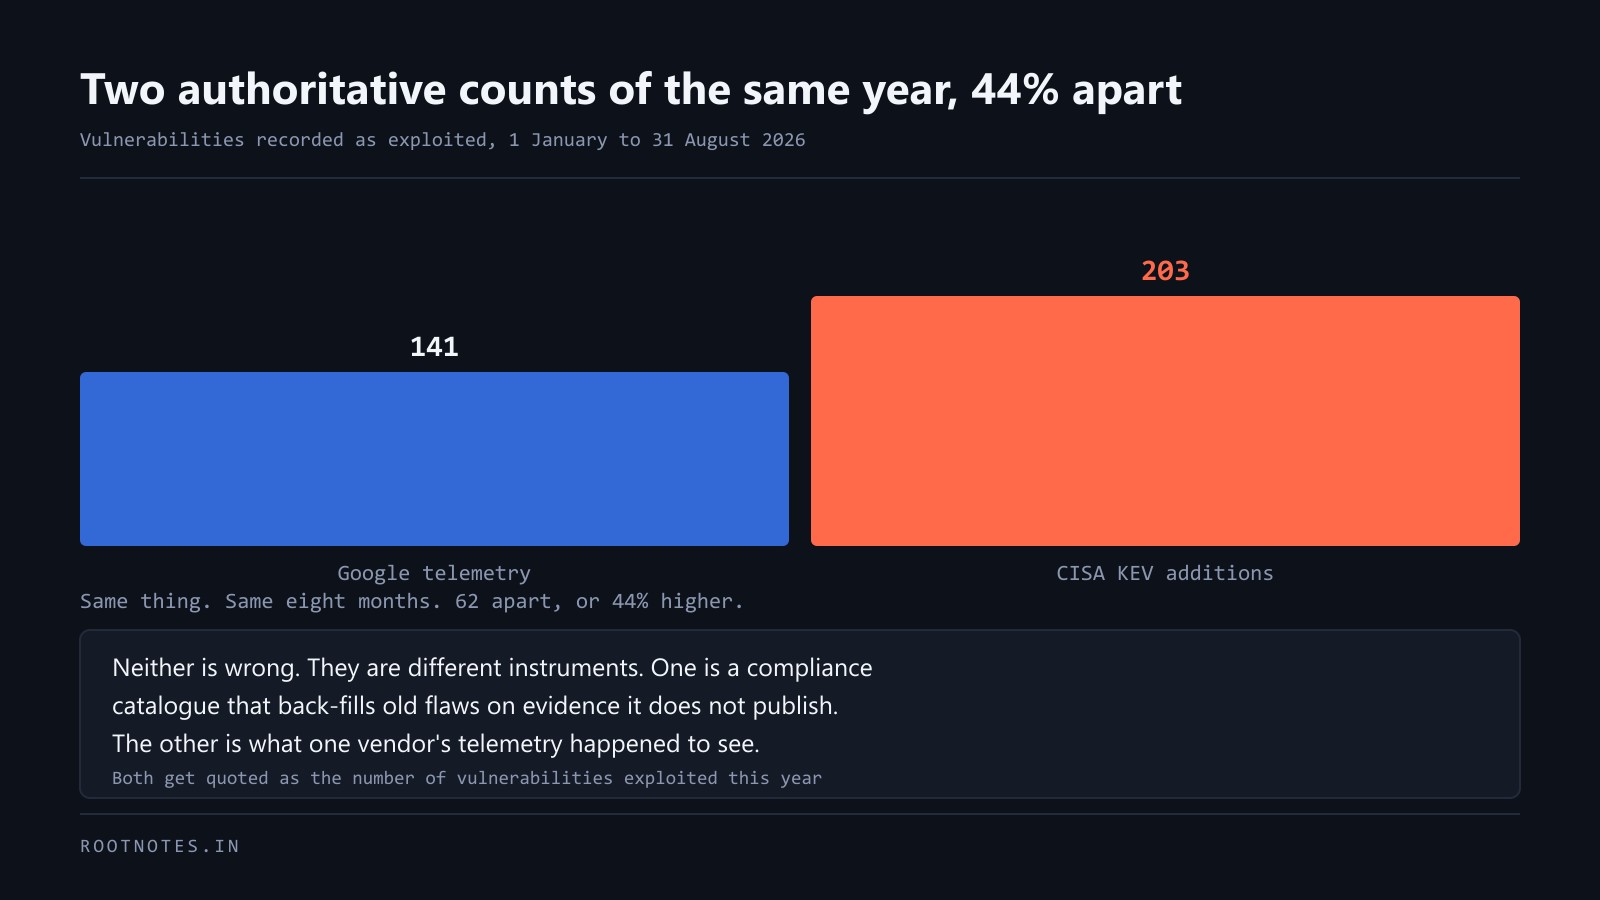
Google Threat Intelligence counted 141 distinct vulnerabilities exploited in the wild between January and August 2026.
We counted CISA's Known Exploited Vulnerabilities additions over exactly the same window, from the published feed. 203.
That is 62 more, or 44 per cent higher, between two of the most cited sources in the industry, measuring what sounds like the same thing over the same eight months.
Neither is wrong. They are different instruments, and the difference between them is worth more than either figure.
What each one is actually measuring
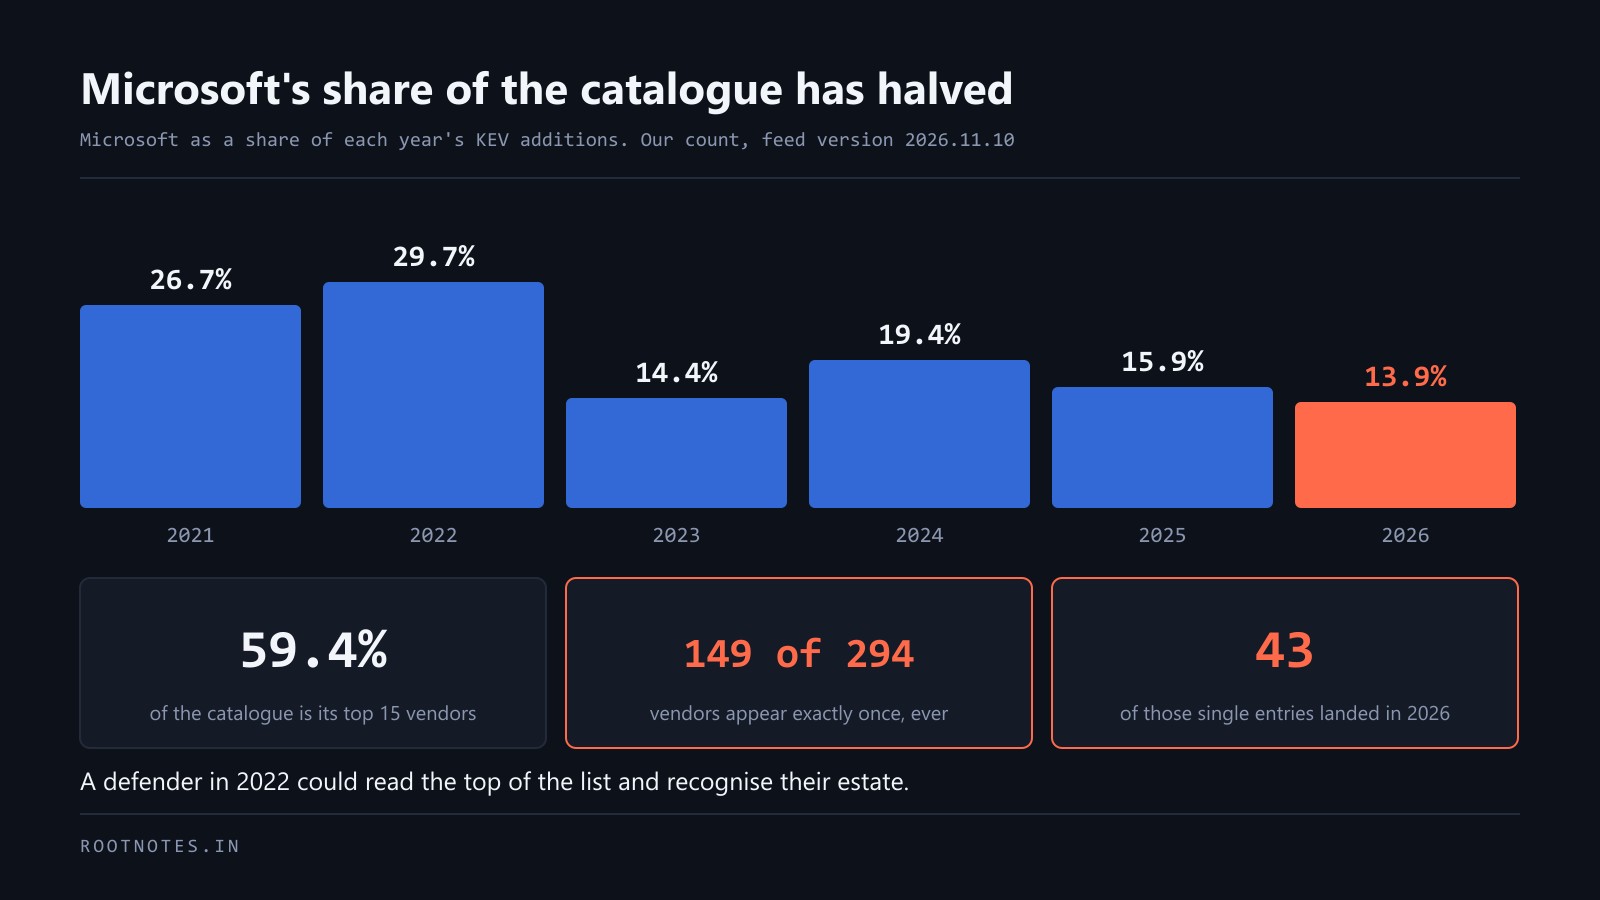
The KEV catalogue is a compliance instrument. An entry means United States federal agencies have a legal deadline to remediate. That purpose shapes the contents. CISA adds flaws on evidence it does not publish, which can include intelligence no vendor would see. It back-fills old flaws when new evidence arrives, so a 2015 vulnerability can be added in 2026 and it counts as a 2026 addition. And an entry is partly a policy decision about what agencies should be made to do, not purely an observation.
Google's number is telemetry. It is what one vendor's visibility, across its own products, customers and incident response, actually observed. That has the opposite bias: it is grounded in things someone watched happen, and it is bounded by where that vendor can see. Exploitation of a product Google has no sensors near does not appear.
So one count includes things nobody publicly observed, and the other excludes things nobody at that vendor could observe. They are not the same set and there is no reason to expect them to converge.
Why it matters that these get mixed
Both figures circulate as "the number of vulnerabilities exploited this year". They appear in board decks, vendor marketing, conference talks, and the opening slide of a great many security strategies. We have seen both used in the same presentation.
If you are building anything on top of one of these numbers, the question to answer first is which instrument you picked and what it structurally cannot see.
A concrete version. Suppose you want to calculate what fraction of published vulnerabilities become dangerous, to decide how aggressively to patch. Use Google's numerator and you are measuring observed exploitation, which is a reasonable proxy for risk to a typical enterprise. Use CISA's and you are measuring something closer to governmental concern, which includes targeted attacks against infrastructure you may not operate. The two answers will differ by nearly half, and the decision you make from them is a budget.
The denominator is worse than the numerator
Google's report contains the more unsettling number. Disclosures rose from 5,045 in January 2026 to 10,477 in July and 10,740 in August, roughly doubling inside the year.
And then the caveat that undoes most of it: Google attributes much of that growth to automated CVE assignment, noting that descriptions for the Linux Kernel alone produced about 5,000 CVEs between January and August, with no observed in-the-wild zero-day exploitation.
Think about what that does to every ratio anyone has ever quoted. If roughly a third of this year's identifiers come from one automated pipeline attached to one project, then "CVEs are up 128 per cent" is a statement about a process change, not about the threat.
Which produces the cleanest figure in the whole report, and the one worth remembering: 0.23 per cent of 2026's disclosures, about one in 431, were observed being exploited.
The honest conclusion
There is no single number. There was never a single number.
What there is: a compliance catalogue that says 203, a vendor telemetry count that says 141, and a disclosure total inflated by automation to the point where any percentage computed against it means less each month.
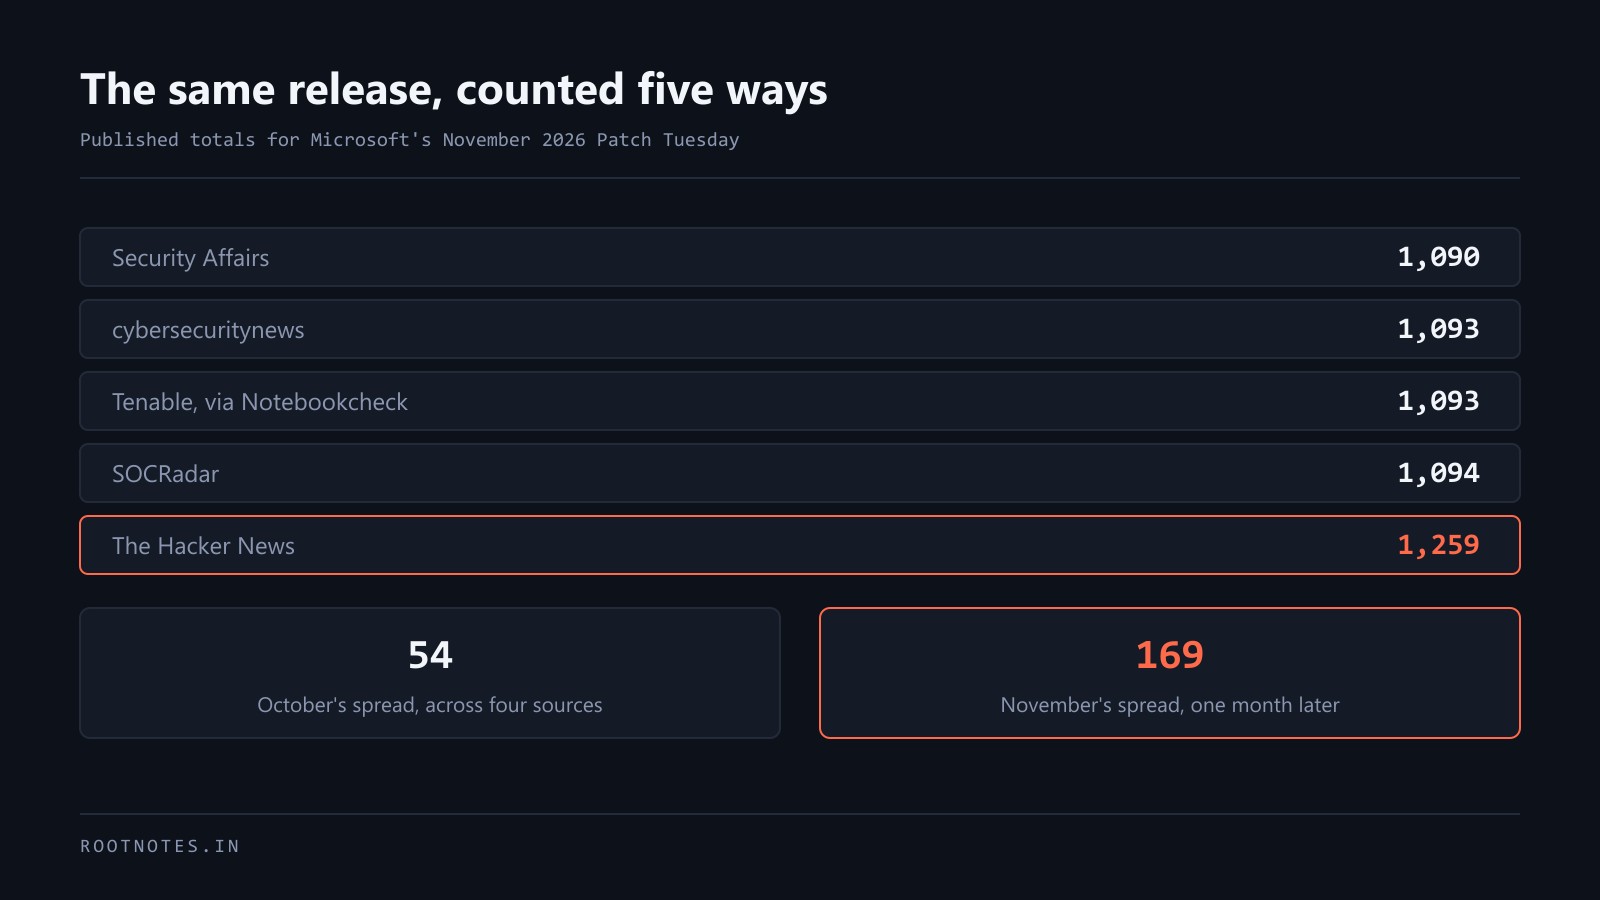
The useful discipline is not to pick the right number. It is to stop quoting any of them without the instrument attached. "203 vulnerabilities were added to the KEV catalogue in eight months" is a true and useful sentence. "203 vulnerabilities were exploited this year" is a different claim that the data does not quite support.
What is not established
- The 203 is ours, computed from KEV feed version 2026.11.10 by counting entries whose date added falls between 1 January and 31 August 2026. It is reproducible, and anyone running the same count on a later feed version will get a slightly different answer, because the catalogue is edited.
- Google's 141 is a count of distinct vulnerabilities its analysts assessed as exploited. We cannot reproduce it and do not know its precise inclusion rules.
- The overlap between the two sets is unknown. We have not attempted to intersect them, and the interesting number would be how many appear in one and not the other.
- Whether the Linux Kernel CNA figure of roughly 5,000 is precise. Google gives it as an approximation.
- Google's 0.23 per cent is computed against its own disclosure total, which is itself affected by the counting problem the same report describes.